From a currency quote to the cost of the spread
Turn the gap between two quoted prices into an amount that makes sense for the size of your position.
Read articleFour prices describe a whole interval. Read the body and wicks, then see which question the candle leaves open.
MilyarFX editorial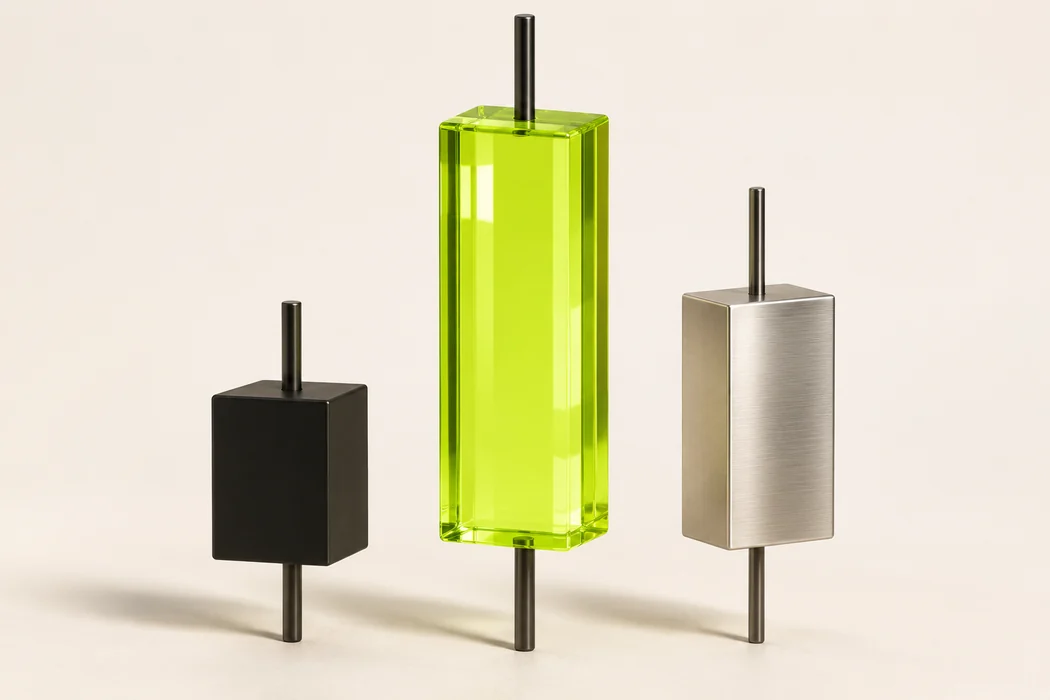
Pick a completed candle on an hourly chart. It records the opening price, highest price, lowest price and closing price for that hour. The last candle can change as quotes arrive until its interval closes. Check the timestamp before comparing it with a screenshot you took earlier in the session.
The body spans the open and close. The wicks extend to the high and low. Suppose a price opens at 100, trades as high as 108 and as low as 97, then closes at 104. The body spans four units and the entire range is eleven. Comparing the close with the open gives you the direction even if the chart uses unfamiliar colours.
The price could visit 97 first and then reach 108. It could also touch 108 first and fall before recovering to the same close. Both paths produce exactly the same hourly candle. Switch to five-minute candles if you need more detail about the sequence. Each smaller candle still compresses what happened inside its interval.
Hide the later candles and describe the hour in one sentence using only the four recorded values. Then reveal the next candle and compare it with your expectations. This separates an observation you can verify from a forecast you made while looking at the chart.

Turn the gap between two quoted prices into an amount that makes sense for the size of your position.
Read article
Follow one copied order from the allocation rule to the execution record and calculate the price difference.
Read article
Both symbols end in USD. The unit being priced and the contract size determine what a move means.
Read article